04 Growing the business & Innovating
In 2024, we delivered strong growth, further expanding our position as a leader in medical dermatology. We exceeded our financial guidance, powered by the successful rollout of Ebglyss® (lebrikizumab) across Europe, the strong performance of our broad dermatology portfolio, FDA approval in the United States, strategic licensing agreements and continued investment in research and collaboration with the dermatology community. The continued strong performance of Ilumetri® (tildrakizumab) and Wynzora® (calcipotriol/betamethasone) are further elements of our sustained growth and momentum in medical dermatology.
OUR FINANCIAL SUCCESS
SUPPORTED BY
Strong sales in the Spanish Market
Our dermatology portfolio
Our legacy non- dermatology portfolio
Physiorelax® (Helenalin2)
Prometax® (rivastigmine patches) acquisitions
We achieved double-digit growth across key markets

As a result of our strong commercial execution, we achieved double-digit growth across key markets and we have announced entering a new era for Almirall delivering double-digit Net Sales growth and increased profitability for years to come.
Our operational performance continued to be solid throughout 2024 despite facing macroeconomic challenges and geopolitical tensions. We achieved this thanks to our strategic focus on medical dermatology, ongoing investment in our R&D activities and key collaborations, including development agreements with Novo Nordisk and Eloxx Pharmaceuticals.
TOTAL REVENUE
€990.6 MM
+10.2% VS. 2023
EBITDA
€192.6 MM
+10.6% VS. 2023
NET SALES
€985.7 MM
+10.2% VS. 2023
R&D INVESTMENT
€124.2 MM
+12.6% VS. Net Sales
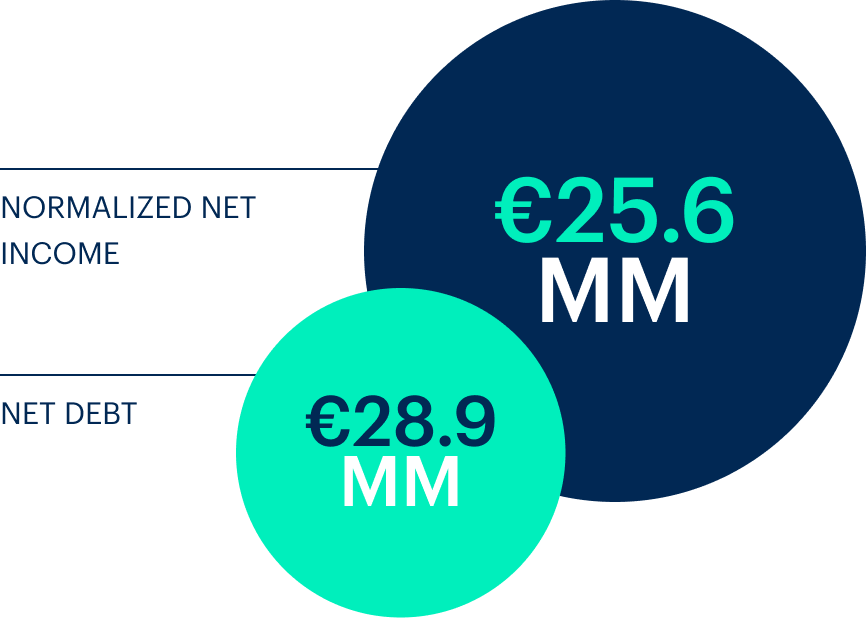
€25.6MM
NORMALIZED NET INCOME
€28.9MM
NET DEBT
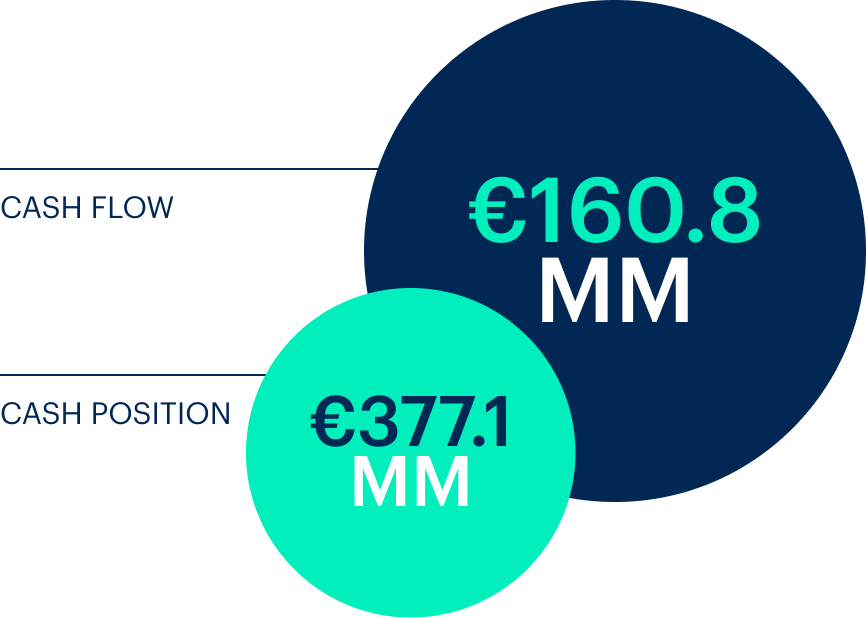
€160.8MM
CASH FLOW
€377.1MM
Cash position
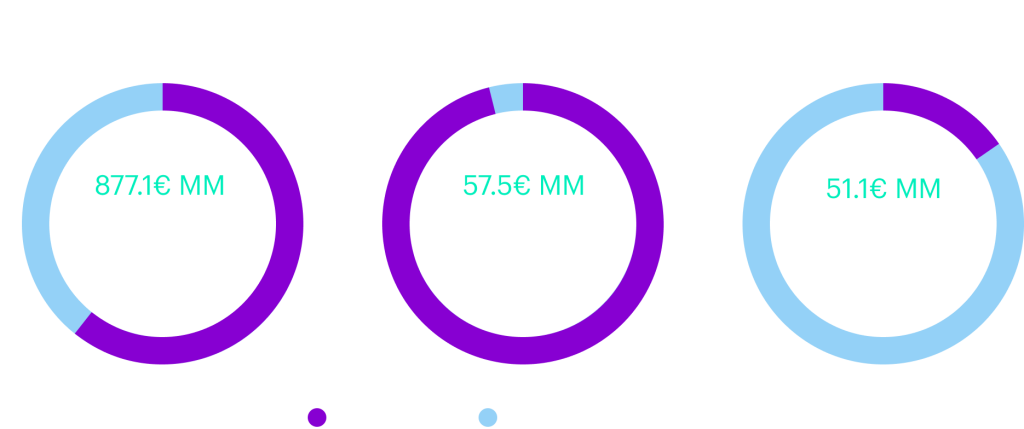
Breakdown of Net Sales
€ Million
Europe
DERMATOLOGY
General Medicine & OTC
FY 2024
€877.1 MM
€484.1 MM
€393.0 MM
FY 2023
€738.8 MM
€395.2 MM
€388.6 MM
% CHG YoY
11.9%
22.5%
1.1%
€ Million
US
DERMATOLOGY
General Medicine & OTC
FY 2024
57.5 MM
56.4 MM
1.1 MM
FY 2023
58.8 MM
58.1 MM
0.7 MM
% CHG YoY
2.2%
2.9%
57.1%
€ Million
RoW
DERMATOLOGY
General Medicine & OTC
FY 2024
51.1 MM
7.6 MM
43.5 MM
FY 2023
51.9 MM
12 MM
39.9 MM
% CHG YoY
1.5%
36.7%
9%
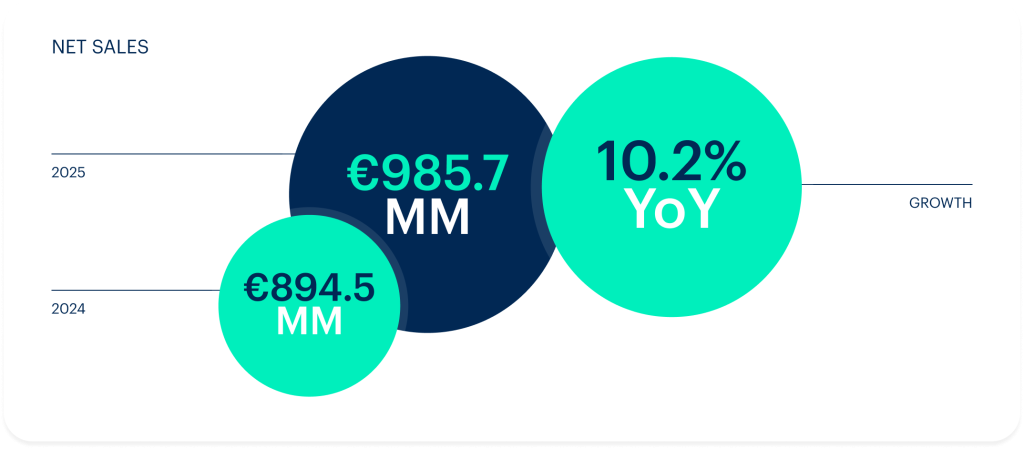
NET SALES
€985.7 MM
2025
€894.5 MM
2024
10.2% YoY
growth
2024 NET SALES BY GEOGRAPHY
877.1€ MM
89% EU
45% - 55%
57.5€ MM
5.8% US
2% - 98%
51.1€ MM
5.2% RoW
15% - 85%
Dermatology
General Medicine & OTC